4.4.1. Measurement values of the required amount of blood in the main group (fictitious values)
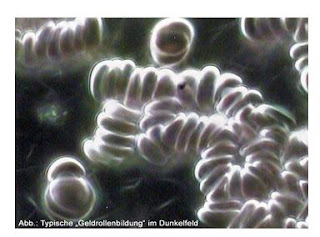
The increase in the required amount of blood, while reducing the external load in subjects with the use of the QHRS biopyramid, had a stimulating effect on the necessary satisfaction of the cells with nutrients. When the required amount of blood increased in the subjects, a decrease in the flow of red blood cells was recorded, and with it an improvement in the ability to close blood capillaries, through the biological effect of the QHRS biopyramid (picture on the right).
| Control Cycle 1 – Blood Amount – Main Group |
|
|
|
|
| Respondents |
Min. |
Max. |
CB |
CO |
| RESPONDENT 1 |
24.45 |
37.15 |
29.90 |
0.12 |
| RESPONDENT 2 |
29.05 |
74.39 |
59.83 |
7.17 |
| RESPONDENT 3 |
8.50 |
16.83 |
13.27 |
1.14 |
| RESPONDENT 6 |
0.70 |
46,41 |
27.47 |
68.70 |
| RESPONDENT 7 |
10,16 |
37,23 |
25.13 |
6.53 |
| RESPONDENT 10 |
13,14 |
38,17 |
25.84 |
4.45 |
| RESPONDENT 11 |
24.97 |
65,92 |
51.18 |
6.85 |
| RESPONDENT 14 |
10,20 |
48.78 |
29.67 |
6.02 |
| RESPONDENT 15 |
48.65 |
125.74 |
87.38 |
13.61 |
| RESPONDENT 18 |
16.54 |
44.86 |
31.18 |
3.96 |
| RESPONDENT 19 |
28,42 |
72.40 |
47.59 |
6.71 |
| CB |
19.53 |
55.26 |
38.95 |
11.39 |
| Control Cycle 2 – Blood Amount – Main Group |
|
|
|
|
| Respondents |
Min. |
Max. |
CB |
CO |
| RESPONDENT 1 |
11,16 |
27.74 |
18.55 |
3.15 |
| RESPONDENT 2 |
12.05 |
59,71 |
47.24 |
54,31 |
| RESPONDENT 3 |
9.93 |
20,11 |
14.53 |
1.59 |
| RESPONDENT 6 |
0.75 |
37.99 |
24.19 |
3.83 |
| RESPONDENT 7 |
9.00 |
64,16 |
49.97 |
9.46 |
| RESPONDENT 10 |
14,10 |
48.74 |
34.37 |
5.76 |
| RESPONDENT 11 |
35,15 |
91.68 |
70.79 |
8.78 |
| RESPONDENT 14 |
8.20 |
46.99 |
30.79 |
6.02 |
| RESPONDENT 15 |
20.94 |
73.29 |
45.78 |
8.83 |
| RESPONDENT 18 |
16.99 |
37.05 |
26.10 |
8.63 |
| RESPONDENT 19 |
41.92 |
84.37 |
55.58 |
49.57 |
| CB |
16.38 |
53.80 |
37.99 |
14.54 |
| Control cycle 3 – amount of blood – Main group |
|
|
|
|
| Respondents |
Min. |
Max. |
CB |
CO |
| RESPONDENT 1 |
19.65 |
38.84 |
28.64 |
3.13 |
| RESPONDENT 2 |
15.72 |
72,74 |
54.96 |
8.63 |
| RESPONDENT 3 |
15.35 |
41.89 |
24.34 |
6.46 |
| RESPONDENT 6 |
0.62 |
29.80 |
18.27 |
3.14 |
| RESPONDENT 7 |
16.75 |
67.75 |
50.31 |
9.62 |
| RESPONDENT 10 |
14.80 |
29.98 |
22.35 |
2.76 |
| RESPONDENT 11 |
28.05 |
90.63 |
65.36 |
10.81 |
| RESPONDENT 14 |
18.78 |
50,71 |
35.76 |
5.52 |
| RESPONDENT 15 |
25.54 |
92.61 |
59.95 |
13.54 |
| RESPONDENT 18 |
16.62 |
30,17 |
17.20 |
2.26 |
| RESPONDENT 19 |
31.76 |
59.02 |
44.65 |
5.46 |
| CB |
18.51 |
54.92 |
38.34 |
6.48 |
| Control Cycle 4 – Blood Amount – Main Group |
|
|
|
|
| Respondents |
Min. |
Max. |
CB |
CO |
| RESPONDENT 1 |
1.46 |
36,31 |
31.19 |
4.41 |
| RESPONDENT 2 |
24.87 |
105.87 |
71.96 |
9.54 |
| RESPONDENT 3 |
55,76 |
93.28 |
69.68 |
6.50 |
| RESPONDENT 6 |
0.54 |
35.83 |
19.10 |
5.33 |
| RESPONDENT 7 |
11,13 |
56,54 |
39.09 |
9.43 |
| RESPONDENT 10 |
13,15 |
44.97 |
26.59 |
5.51 |
| RESPONDENT 11 |
24.52 |
107.02 |
73.40 |
13,28 |
| RESPONDENT 14 |
28.45 |
79.40 |
51.64 |
10.32 |
| RESPONDENT 15 |
19.77 |
146.79 |
63.40 |
25.55 |
| RESPONDENT 18 |
24.87 |
53,44 |
43.96 |
6.04 |
| RESPONDENT 19 |
30.96 |
70.75 |
45.42 |
6.90 |
| CB |
21.41 |
75.47 |
48.68 |
9.35 |
| Conclusion of the development of the required amount of blood - Main group |
|
|
|
| Cycle |
Min. |
Max. |
CB |
CO |
| Control cycle 1 |
19.53 |
55.26 |
38.95 |
11.39 |
| Control cycle 2 |
16.38 |
53.80 |
37.99 |
14.54 |
| Control cycle 3 |
18.51 |
54.92 |
38.34 |
6.48 |
| Control cycle 4 |
21.41 |
75.47 |
48.68 |
9.35 |
| CB |
18.96 |
59.86 |
40.99 |
10.44 |
The required amount of blood is investigated through the process of photoplethysmography. It is a physically easy and non-invasive process of presenting changes in circulation. The displayed values are for maximum circulation research and with good circulation they can go above 100%.
The development of the mean value of the amount of blood in the subjects in the control group is constant in the control cycles 1-3. mean blood volume requirements decrease, but in this case not below the lowest level. In control cycle 4, a clear increase in the amount of blood, more than 20%, can be seen in separate subjects in the main group.
Subscribe to receive the latest updates on radiation protection and natural medicine.
No spam
Unsubscribe anytime
Share this knowledge
Help others learn more about natural space harmonization.