
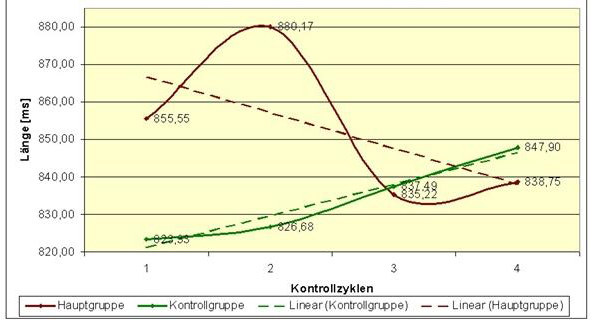
| Measurement values of mean heart beat length | ||
| Cycle | Main Group | Control group |
| Control cycle 1 | 855.55 | 823.33 |
| Control cycle 2 | 880.17 | 826.68 |
| Control cycle 3 | 835.22 | 837.49 |
| Control cycle 4 | 838.75 | 847.90 |
| CB | 856.98 | 829.17 |

The development of the mean length of the heartbeat affects the increase or decrease of the RR-interval spectrum, which is necessary to correct the vegetative balance of the organism in connection with current internal and external stimuli. as shown in the graph, the clear decrease in the mean length of heart beats in subjects in the main group can only be explained by the reduction of external influences by QHRS Biopyramid. The trend line of tested persons in the main group has a decreasing flow during the checks. In the test subjects in the control group, there is a constant increasing trend in the average value of the length of heart beats in all control cycles.
