
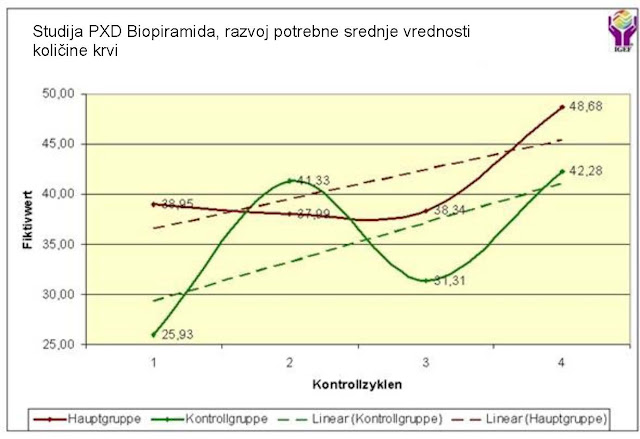
Overview of measured values:
| Measurement values of mean blood volume | ||
| Cycle | GK | GK |
| Control cycle 1 | 38.95 | 25.93 |
| Control cycle 2 | 37.99 | 41.33 |
| Control cycle 3 | 38.34 | 31.31 |
| Control cycle 4 | 48.68 | 42.28 |
| CB | 40.99 | 35.22 |

The trend line of the mean value of the required amount of blood in the two tested groups is at the highest level. The mean value of the required amount of blood in subjects from the main group lies in a neutral position, but at a higher level. With the use of the QHRS biopyramid, the mean value of the required amount of blood remains at least at this level, and a clear increase in the required amount of blood should be observed in the 4th control cycle. This tendency was caused by a few subjects with highly variable blood pressure.
