
Overview of measured values:
| Mean skin conductance values in the main and control groups | ||
| Cycle | Main Group | Control group |
| Control cycle 1 | 1.27 | 1.08 |
| Control cycle 2 | 0.88 | 1.00 |
| Control cycle 3 | 1.06 | 1.15 |
| Control cycle 4 | 0.83 | 0.88 |
| Mean, | 1.01 | 1.03 |

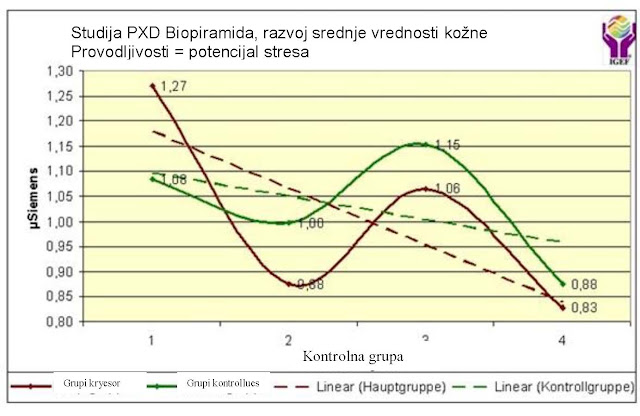
The trend of development of skin conductivity in subjects in the main group (brown color) significantly decreases despite the increase in the mean value of conductivity in control cycle 1.
The trend of increasing stress potential in control cycle 3 is essentially determined by one subject. In the majority of subjects in the main group, the stress potential is reduced for the duration of the research, thanks to the harmonizing effect of the QHRS biopyramid in all control cycles.
The average values of skin conductivity in subjects in the control group change sporadically in control cycle 3, and even reach an increase of almost 10% compared to the neutral value.
It is not possible to determine the influence of placebo based on standard deviations in all control cycles. At a relatively reduced level of stress potential during the neutral measurement in all subjects, a harmonizing effect can be seen, especially in individual observations of subjects in the main group.
The trend of increasing stress potential in control cycle 3 is essentially determined by one subject. In the majority of subjects in the main group, the stress potential is reduced for the duration of the research, thanks to the harmonizing effect of the QHRS biopyramid in all control cycles.
The average values of skin conductivity in subjects in the control group change sporadically in control cycle 3, and even reach an increase of almost 10% compared to the neutral value.
It is not possible to determine the influence of placebo based on standard deviations in all control cycles. At a relatively reduced level of stress potential during the neutral measurement in all subjects, a harmonizing effect can be seen, especially in individual observations of subjects in the main group.
