
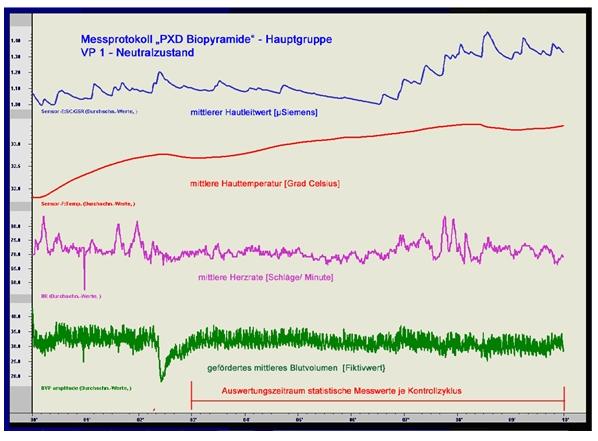
Graphics from the sessions of this research were chosen with the aim of better understanding the results of the respondents in the main and control groups. Evaluation of tests is basically based on statistically processed data from measurements that entered the records. ...
In principle, the following signals of the vegetative nervous system are presented in the measurement records from each session as a line graph:
In principle, the following signals of the vegetative nervous system are presented in the measurement records from each session as a line graph:
- SC/GSR - skin conductance value (measured in µSiemens) - gray color
- Skin temperature (measured in degrees Celsius) – red color
- Heart beats (per minute) - purple color
- Pulse volume amplitude (represents the difference between the maximum and minimum blood volume within one heartbeat) - green color

In each graph, the x-axis represents time in minutes, while for each of these measurements, depending on the maximum measurement values, there is a separate i-axis.
The report from each individual measurement is usually presented for 10 minutes. Horizontal footnotes represent notes on some peculiar actions of individual subjects during the duration of the procedure.
Each of the presented curve lines for signals is measured with scales of at least 24 measurement units per second and is presented in a precise manner. The measured values are
determined in accordance with recognized mathematical methods in each moment of the measurement evaluation via the BioTrace+ software and consequently are shown for each signal in a separate table.
The observation of statistical values of standard deviations can give us data that speak about the change in the geometric statics of the signal in the process of harmonization. For the procedure described here, this can be interesting in the case of monitoring changes in skin temperature.
Testing the number of heart beats per minute in a biological study in such a load environment can lead to precise data, since the variability of the heart rate can be influenced by the replacement of sympathetic and parasympathetic, under the influence of harmful fields, enemies of the vegetative nervous system.
Heart beat variability (VSF, german. HRV) describes the heart's ability to continuously and independently of the effects of harmful fields, change the duration of the interval from one beat to the next and to flexibly adapt to internal and external loads.
Having this in mind, VSF becomes a measure of the general adaptability of the organism to internal and external factors. The autonomic nervous system is responsible for the adaptation of the organism. It is impossible to consciously influence the VSF and therefore it is valid as a credible measure, e.g. for physical effort.
Within the framework of the entire research, the development of criteria for VSF in subjects in the main and control groups was examined with evaluation by a program function
BioTrace+ software. Individuals with limited VSF function only in one limited sphere and often get tired when they are exposed to some bigger "current problems". Such individuals perceive this as "stress", as a disturbed relationship between the immediate demands of the field with a harmful effect on the one hand and the organism's ability to overcome the situation and restore balance on the other. diseases of the heart and blood flow, depression, neuropathy, or cancerous diseases. Bearing this in mind, it is extremely interesting that the application of the QHRS biopyramid improves VSF.
The relatively small number of tested subjects does not allow a pure mathematical-statistical assessment. For 100% statistically reliable information, the number of respondents, as well as the number of measured values, must be higher. The respondents were verbally asked, during the duration of the control cycles, for their personal opinion regarding the QHRS biopyramid.
