
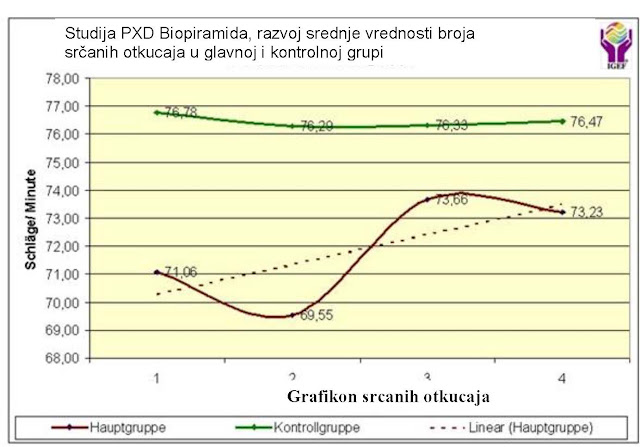
Overview of measured values of the average heart rate:
| View average heart rate measurements | ||
| Cycle | GG | KG |
| Control cycle 1 | 71.06 | 76.78 |
| Control cycle 2 | 69.55 | 76.29 |
| Control cycle 3 | 73.66 | 76.33 |
| Control cycle 4 | 73.23 | 76.47 |
| Mean | 71.88 | 76.47 |
Contrary to the development of the mean value of heart beats in subjects in the main group, no significant development was observed in the values of subjects in the control group. Protocol mean heart rate values in the control group are almost equal in all control cycles. The trend line is horizontal.

The heart rate trend line in subjects in the main group increases linearly during all control cycles. The increase in the number of heartbeats in the monitoring period of only one month clearly indicates the harmonization of external influences by the QHRS biopyramid in the subjects in the main group.
This thesis should be checked by filtering the tested in the main and control groups separately depending on two types of reactions:
This thesis should be checked by filtering the tested in the main and control groups separately depending on two types of reactions:
- Subjects with heart rates < 80 beats/minute
- Subjects with a heart rate > 80 beats/minute
